
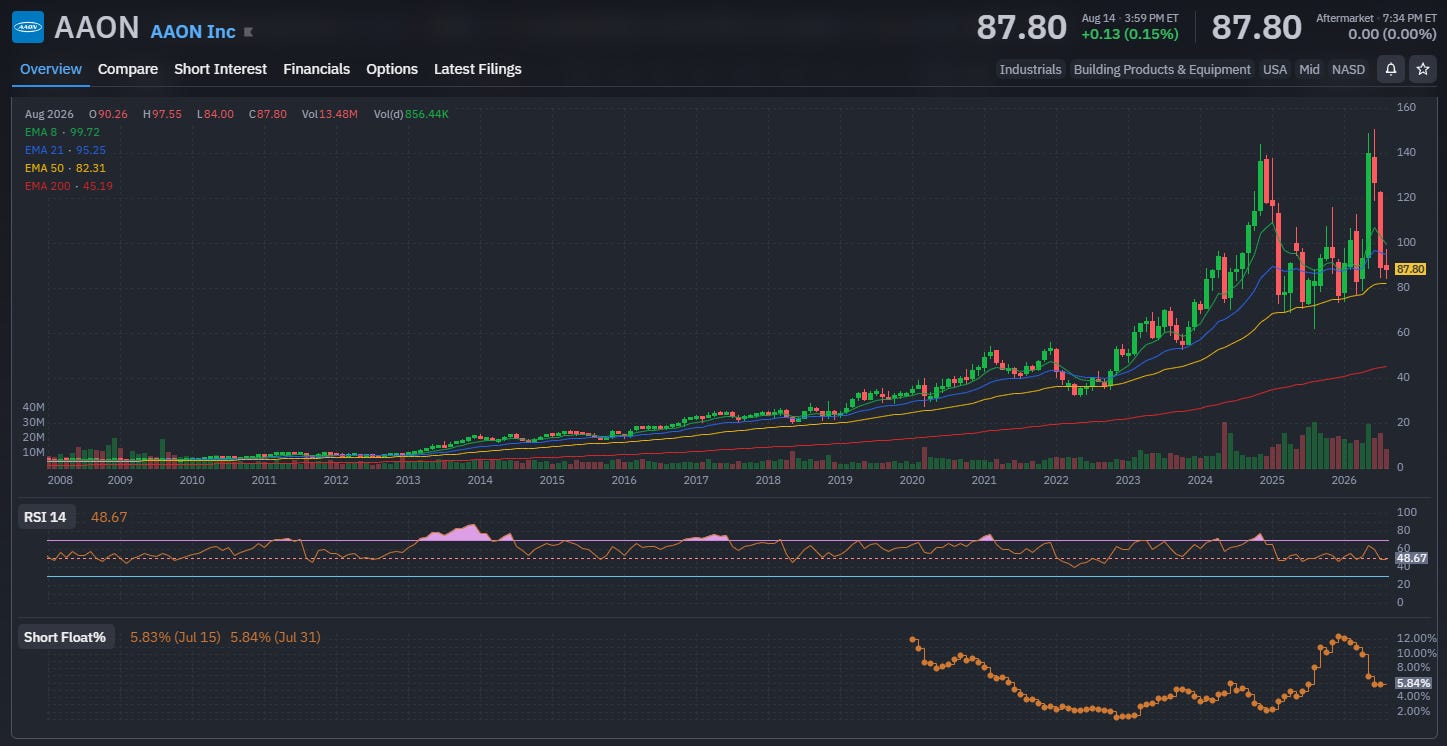
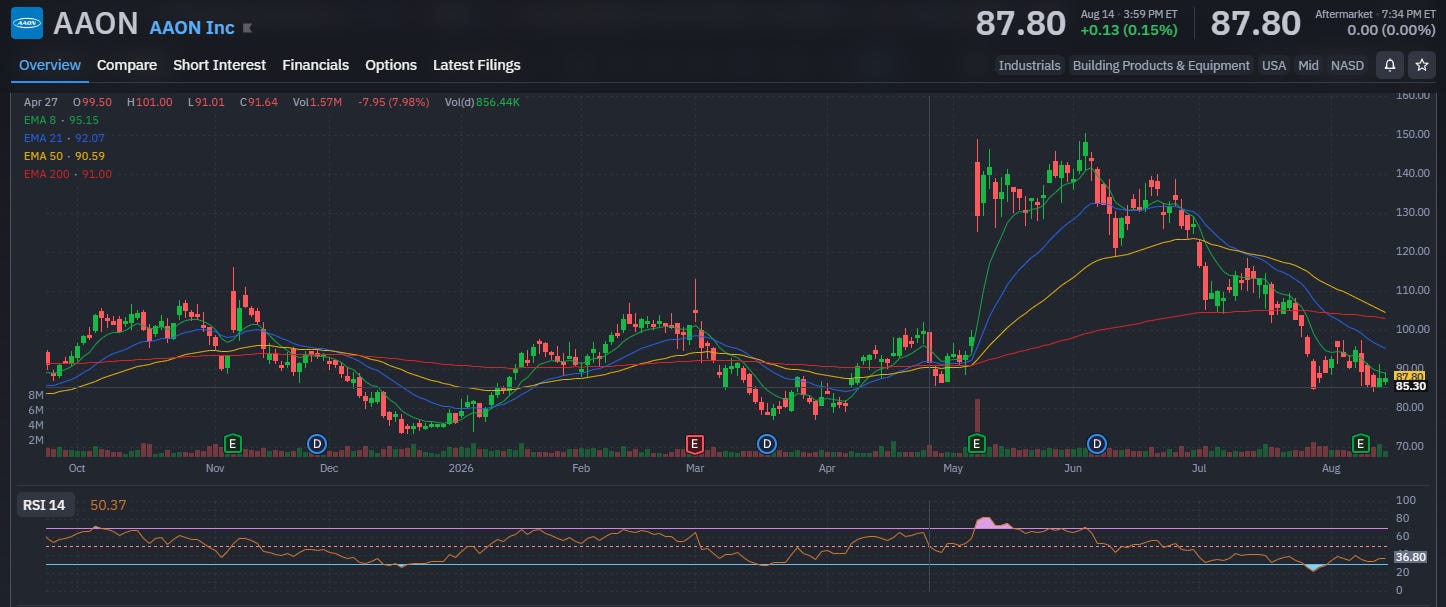
AAON has been cut more than 40% from its June high and is testing the April low on the Daily while approaching its rising 50EMA on the Monthly.
Add a Tier 1 score in my model, strong revenue growth, real profitability, heavy institutional ownership and a much more reasonable valuation after the selloff and there’s enough here to get me interested in the bounce.
AAON Inc.
AAON designs and manufactures HVAC equipment for commercial and industrial buildings, including rooftop units, air handling systems and data center cooling equipment.
Fundamentals & Ownership
Market cap: $7.2B
Current P/E 45.9 | Forward P/E 24.6
Annual sales rising since 2018
EPS growth next year: 51.2%
Institutional ownership: 83.6%
Insider ownership: 16.7%
Short float: 5.8%
Clean balance sheet with low debt
Technicals
On the Monthly, the long-term uptrend remains intact with price approaching the rising 50EMA. This is the chart that gets me most interested in the trade. The 50EMA has been durable support and a reliable bounce point since 1997.
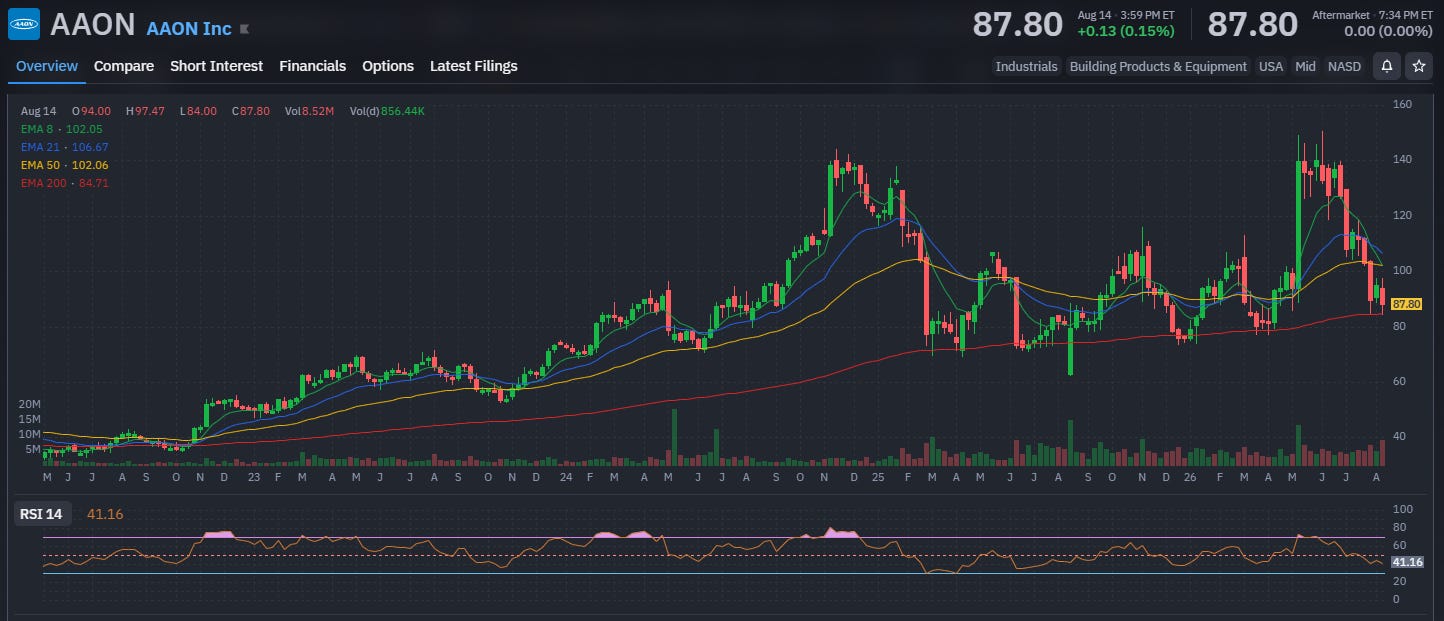
On the Weekly, price is holding the rising 200EMA.
On the Daily, RSI has bottomed out and price held the April low.
Monthly
Weekly
Daily
Risks
This is a purely technical bounce setup for me so the risk is a breakdown of long-term support.
How I’m Trading It
Shares + December ATM calls. I’ll be quick on the trigger to sell my calls for a profit and roll back to cash.
I’m looking for the April low to continue holding and for price action to confirm the bounce near current levels.
The 50EMA on the Monthly is $82 and it’s my line in the sand. A sustained break below that support would invalidate the setup.
I trade what I post.
Weekly Picks and occasional Trade Notes for subscribers.
This isn’t an alert service, and I’m not your financial advisor.
Just sharing the trades I take. Putting it out in public keeps me disciplined.
Find value here? Subscribe free and pass it along.
Clear trades. No clutter.